
We can output a visualization of a Keras deep learning model using the plot_model utility function.
First the dependencies need to be installed:
$ pip install pydot
$ pip install pydotplus
$ pip install graphviz
We also need the graphviz binary:
$ sudo port install graphviz
It is also possible to use Brew (brew install graphviz).
This example code outputs a model diagram:
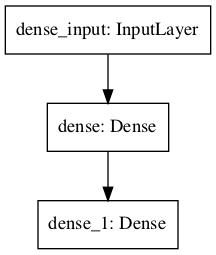
from keras import layers
from keras import models
from keras.utils import plot_model

network = models.Sequential()

network.add(layers.Dense(512, activation='relu', input_shape=(28*28,)))
network.add(layers.Dense(10, activation='softmax'))

plot_model(network)
This will generate the model plot in a PNG file named model.png by default.
View the result diagram image:
$ open model.png
Result image:
We can also specify a different file name in the call:
plot_model(network, to_file='my-model.png')
To also include layer shapes in the plot, omitted by default:
plot_model(network, show_shapes=True)